The 3D Moon: its sites and sources
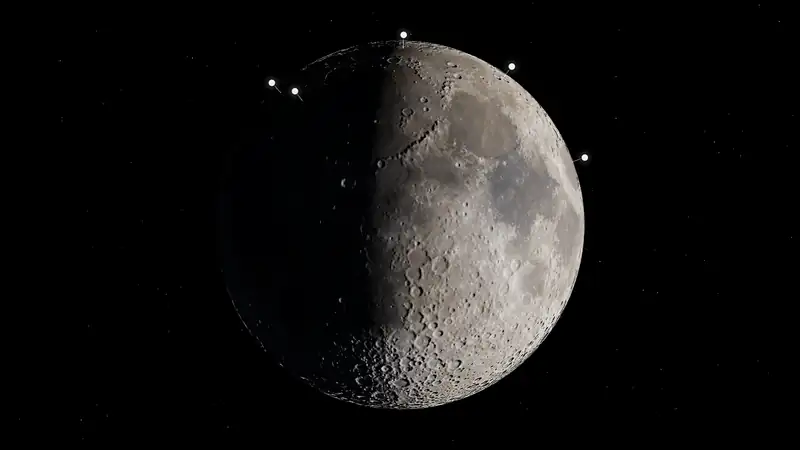
The view above draws the Moon with sunlight from the Sun's computed direction for the time shown, NASA's terrain around the south pole, and a marker at each place a space resource mission record names. Sites and mission records are listed here as ordinary links. Sun estimates need the interactive view.
Has there been a commercial delivery of a resource from the Moon, an asteroid, or Mars? No commercial delivery in this dataset.
The Moon map gives the same sites as a flat map, and Lunar south pole missions has the measuring tool.
How far has anyone got?
40 lunar recordsEach number counts lunar mission records naming that resource, at the furthest step the record reached for it. A record naming two resources counts in both rows, so the rows do not add up to All resources. Records with no marker are counted too: they name a region and no site, orbit the Moon or have no map point. 1 lunar record names no resource and is not counted: Moon Express MX-1E first lunar mission (Google Lunar XPRIZE attempt).
| Resource | Claimed | Targeted | Detected | Prospected | Sampled | Processing demo | Commercial delivery | Records | No marker | Markers |
|---|---|---|---|---|---|---|---|---|---|---|
| All resources | 0 | 34 | 2 | 0 | 3 | 0 | 0 | 39 | 21 | 10 of 10 |
| Water iceShow on the Moon | 0 | 24 | 1 | 0 | 0 | 0 | 0 | 25 | 13 | 5 of 10 |
| VolatilesShow on the Moon | 0 | 19 | 2 | 0 | 2 | 0 | 0 | 23 | 12 | 6 of 10 |
| RegolithShow on the Moon | 0 | 9 | 0 | 0 | 3 | 0 | 0 | 12 | 4 | 6 of 10 |
| Helium-3Show on the Moon | 0 | 5 | 0 | 0 | 0 | 0 | 0 | 5 | 5 | 0 of 10 |
| OxygenShow on the Moon | 0 | 4 | 0 | 0 | 0 | 0 | 0 | 4 | 2 | 1 of 10 |
| Metals (general)Show on the Moon | 0 | 2 | 0 | 0 | 0 | 0 | 0 | 2 | 2 | 0 of 10 |
| Rare earthsShow on the Moon | 0 | 1 | 0 | 0 | 0 | 0 | 0 | 1 | 1 | 0 of 10 |
Marker colours, from the lowest step
- Claimed says it will
- Targeted mission aimed at it
- Detected presence reported
- Prospected measured on site
- Sampled material collected, not extraction
- Processing demo extraction demo
- Commercial delivery sold or delivered
- Solid: no record there is not yet launched.
- Ring: at least one record there is not yet launched.
A marker's colour is the furthest step any record there reached, or with a resource chosen the furthest step for that resource. Its shape is always about every record there. A step says how far a record got, not that the resource is known to be at that spot or how much of it there is. A marker is a named feature's centre or printed coordinates, not a landing point. A ring means a record at that site, for any resource, is not yet launched.
Sites and their mission records
18 of 40 lunar records placed at 10 sitesNorthernmost first. A marker is a named feature's centre or coordinates printed in a record, not a landing point. A ring means at least one record there is not yet launched.
Mare Frigoris
60.5°N, 4.6°W · 2 mission records, none still planned · Show on the Moon
Furthest step on record here: targeted (mission aimed at it)
- SMBC x HAKUTO-R Venture Moon (ispace Mission 2, RESILIENCE lander)ispace, inc. · 2025-01-15 · Outcome: FailureRegolith: targeted
How this launch date changed
- 2024-12-17: 2024 (planned) → no earlier than January 2025Schedule slip [13]
Recorded change: the plan before → the plan after, oldest first. Only changes recorded here are listed. The oldest date shown may not be the first plan ever announced, and a date with no recorded change may still have moved. A plan is not a launch. All recorded schedule changes
- TENACIOUS micro-rover (ispace-EUROPE)ispace EUROPE S.A. · 2025-01-15 · Outcome: FailureRegolith: targeted
- SMBC x HAKUTO-R Venture Moon (ispace Mission 2, RESILIENCE lander)ispace, inc. · 2025-01-15 · Outcome: FailureRegolith: targeted
Atlas crater
47.5°N, 44.4°E · 1 mission record, none still planned · Show on the Moon
Furthest step on record here: targeted (mission aimed at it)
- HAKUTO-R Mission 1 (ispace M1 lander)ispace, inc. · 2022-12-11 · Outcome: FailureRegolith: targeted
Mons Rümker
40.76°N, 58.38°W · 1 mission record, none still planned · Show on the Moon
Furthest step on record here: sampled (material collected, not extraction)
- Chang'e-5China National Space Administration · 2020-11-24 · Outcome: SuccessRegolith, volatiles: sampled
Sinus Viscositatis
35.25°N, 40.99°W · 1 mission record, none still planned · Show on the Moon
Furthest step on record here: targeted (mission aimed at it)
- Astrobotic Peregrine Mission OneAstrobotic Technology · 2024-01-08 · Outcome: FailureWater ice, volatiles: targeted
Mons Latreille
18.47°N, 61.92°E · 1 mission record, none still planned · Show on the Moon
Furthest step on record here: sampled (material collected, not extraction)
- Firefly Blue Ghost Mission 1 (Ghost Riders in the Sky)Firefly Aerospace · 2025-01-15 · Outcome: SuccessRegolith: sampled
Nassau crater
24.91°S, 177.34°E · 1 mission record, 1 not yet launched · Show on the Moon
Furthest step on record here: targeted (mission aimed at it)
- Firefly Blue Ghost Mission 2 (Riders 2 the Dark)Firefly Aerospace · Planned, no earlier than 2027 · PlannedWater ice: targeted
How this launch date changed
- 2026: 2026 → 2027 (net)Schedule slip [1]
Recorded change: the plan before → the plan after, oldest first. Only changes recorded here are listed. The oldest date shown may not be the first plan ever announced, and a date with no recorded change may still have moved. A plan is not a launch. All recorded schedule changes
- Firefly Blue Ghost Mission 2 (Riders 2 the Dark)Firefly Aerospace · Planned, no earlier than 2027 · PlannedWater ice: targeted
Apollo basin
35.69°S, 151.48°W · 1 mission record, none still planned · Show on the Moon
Furthest step on record here: sampled (material collected, not extraction)
- Chang'e-6China National Space Administration · 2024-05-03 · Outcome: SuccessRegolith, volatiles: sampled
Mons Mouton
84.60°S, 31.00°E · 7 mission records, 3 not yet launched · Show on the Moon
Furthest step on record here: targeted (mission aimed at it)
- Intuitive Machines IM-2 (Athena lander)Intuitive Machines · 2025-02-26 · Outcome: PartialWater ice, volatiles, regolith: targeted
- Lunar Outpost Lunar Voyage 1 (MAPP rover on IM-2)Lunar Outpost · 2025-02-26 · Outcome: FailureRegolith, water ice: targeted
- PRIME-1 (Polar Resources Ice Mining Experiment-1)National Aeronautics and Space Administration · 2025-02-26 · Outcome: PartialWater ice, volatiles: targeted
- Puli Lunar Water Snooper (PLWS) on IM-2Puli Space Technologies · 2025-02-26 · Outcome: UnknownWater ice: targeted
- Intuitive Machines IM-4 (Nova-C lander, NASA CLPS task order CP-22)Intuitive Machines · Planned 2027 (target) · PlannedWater ice, volatiles, oxygen: targeted
- PROSPECT (Package for Resource Observation, in-Situ Prospecting for Exploration, Characterisation & Testing)European Space Agency · Planned 2027 (target) · PlannedWater ice, volatiles, oxygen: targeted
- VIPER (Volatiles Investigating Polar Exploration Rover)National Aeronautics and Space Administration · Landing: Planned 2027 H2 (target) · PlannedWater ice, volatiles: targeted
How this delivery date changed
- 2022-07-18: 2023 (late) → 2024-11Schedule slip [8]
- 2024-07-17: Phase: In development → CancelledSource update [1]
- 2025-09-19: 2024-11 → 2027 (late)Schedule slip [2]
Recorded change: the plan before → the plan after, oldest first. Only changes recorded here are listed. The oldest date shown may not be the first plan ever announced, and a date with no recorded change may still have moved. A plan is not a launch. All recorded schedule changes
Cabeus crater
85.33°S, 42.13°W · 1 mission record, none still planned · Show on the Moon
Furthest step on record here: detected (presence reported)
- LCROSS (Lunar Crater Observation and Sensing Satellite)National Aeronautics and Space Administration · 2009-06-18 · Outcome: SuccessWater ice, volatiles: detected
Haworth crater
87.45°S, 5.17°W · 2 mission records, 2 not yet launched · Show on the Moon
Furthest step on record here: targeted (mission aimed at it)
- Firefly Blue Ghost Mission 4 (NASA CLPS task order CS-6, lunar south pole)Firefly Aerospace · Planned, no earlier than 2029 · PlannedWater ice, volatiles: targeted
- MoonRanger micro-rover (Astrobotic / Carnegie Mellon University, Neutron Spectrometer System)National Aeronautics and Space Administration · Planned, no earlier than 2029 · PlannedWater ice, volatiles: targeted
South pole
13 records10 records are placed at Mons Mouton, Cabeus crater and Haworth crater. These others name the region or orbit it, so they have no marker. 20 of the 23 records for this region name water ice or volatiles as a resource. Permanently shadowed ground can contain cold traps where water ice could survive.
Records naming only the region
- Blue Moon Mark 1 (second lander) - VIPER deliveryThe record names only the lunar south polar region.Water ice, volatiles: targeted
- Canadian Lunar Rover Mission (CSA Lunar Rover Mission, LRM)The record names only the lunar south polar region.Water ice, volatiles: targeted
- Chang'e-7The record names only the lunar south polar region.Water ice, volatiles: targeted
How this launch date changed
- 2026-08-19: around 2026 (CNSA, April 2024) → 2026-08 window (vehicle on pad 2026-08-19)Source update [8]
- 2026-08-23: 2026-08 window → unannounced; not in the planned 2026 windowSchedule slip [4]
Recorded change: the plan before → the plan after, oldest first. Only changes recorded here are listed. The oldest date shown may not be the first plan ever announced, and a date with no recorded change may still have moved. A plan is not a launch. All recorded schedule changes
- Chang'e-8Leibnitz-Beta Plateau is not an IAU-approved feature name, so no centre is plotted.Regolith: targeted
- Griffin Mission One (Griffin-1, NASA Moon Base II)NASA names Nobile Crater, while Voyager's 22 October 2026 article says near Mons Mouton; no centre is plotted until the difference is resolved.Helium-3: targeted
How this launch date changed
- 2026-05-26: no earlier than fall 2025 → late 2026 (2026-H2 target)Schedule slip [3]
- 2026-11-01: late 2026 (2026-H2 target) → no earlier than November 2026 (2026-11 net)Source update [13]
Recorded change: the plan before → the plan after, oldest first. Only changes recorded here are listed. The oldest date shown may not be the first plan ever announced, and a date with no recorded change may still have moved. A plan is not a launch. All recorded schedule changes
- Intuitive Machines CLPS south-pole delivery (2026 award, 2030 target)The record names only the lunar south polar region.Volatiles, water ice: targeted
- ispace Mission 4 (ULTRA lander; formerly Mission 6)The record names only the lunar south polar region.Water ice, volatiles: targeted
- LUPEX / Chandrayaan-5 (Lunar Polar Exploration mission)The record names only the lunar south polar region.Water ice, volatiles: targeted
- MAGPIE (Mission for Advanced Geophysics and Polar Ice Exploration) roverThe record names only the lunar south polar region.Water ice, volatiles: targeted
How this launch date changed
- 2026-09-02: 2028 (launch window, ispace September 2025) → 2029 (scheduled launch, ispace September 2026)Source update [10]
Recorded change: the plan before → the plan after, oldest first. Only changes recorded here are listed. The oldest date shown may not be the first plan ever announced, and a date with no recorded change may still have moved. A plan is not a launch. All recorded schedule changes
- Masten Mission One (XL-1 lander, NASA CLPS task order TO19C)The record names only the lunar south polar region.Water ice, volatiles, regolith: targeted
How this launch date changed
- 2021: 2022-11 (task-order launch date, NASA OIG) → 2023-11Schedule slip [8]
Recorded change: the plan before → the plan after, oldest first. Only changes recorded here are listed. The oldest date shown may not be the first plan ever announced, and a date with no recorded change may still have moved. A plan is not a launch. All recorded schedule changes
- METAL multispectral camera (Interlune / NASA Ames) on Griffin-1NASA names Nobile Crater, while Voyager's 22 October 2026 article says near Mons Mouton; no centre is plotted until the difference is resolved.Helium-3: targeted
How this launch date changed
- 2025-10-24: 2025 (end of year, per Interlune staff quoted by GeekWire) → 2026-07 (NET, Astrobotic)Schedule slip [5]
- 2026-06-15: 2026-07 (NET) → 2026-H2 (late 2026)Schedule slip [4]
Recorded change: the plan before → the plan after, oldest first. Only changes recorded here are listed. The oldest date shown may not be the first plan ever announced, and a date with no recorded change may still have moved. A plan is not a launch. All recorded schedule changes
- PROMISE (Polar Rover for Observation, Mapping, and In-Situ Exploration)The record names only the lunar south polar region.Water ice: targeted
Orbiters aimed at the south pole
- Lunar FlashlightNational Aeronautics and Space Administration · 2022-12-11 · Outcome: FailureWater ice: targeted
Next scheduled in these records: METAL multispectral camera (Interlune / NASA Ames) on Griffin-1 (Interlune), launch: Planned 2026 H2 (target) · All upcoming
Next up
Next scheduled in these records: METAL multispectral camera (Interlune / NASA Ames) on Griffin-1 (Interlune), launch: Planned 2026 H2 (target) · All upcoming
About this view
Sun and Earth: Computed for the time shown with a standard low-precision method (Meeus, Astronomical Algorithms), good to a few tenths of a degree. This is a picture, not a tool for planning a landing.
Light: Terrain shading comes from the Sun's direction on NASA's height grid, so small features and very long shadows are approximate. A faint fixed fill light keeps shadows from going fully black; it is not computed earthshine. Exposure changes between views.
Globe: Colour and relief from NASA's Scientific Visualization Studio CGI Moon Kit, public domain, optimised for appearance. Relief is shading only.
South pole: Heights from the LOLA grid LDEM_75S_240M (LRO LOLA team, NASA Planetary Data System), averaged to 960 m a cell and placed on the sphere at true size, with native 240 m cells around a chosen site. Heights are true to scale unless you pick Heights ×2, and shadows at ×2 are illustrative. The lighter view draws every second cell of these grids.
Cyan: Ground in permanent shadow, from NASA's LOLA map (Barker et al. 2023), in 960 m cells and in 240 m cells around a chosen site. It shows darkness, not ice. Shadowed ground can hold cold traps; this layer does not detect anything in them. Shadow data covers 80°S to the pole.
Markers: The centre of the named feature or coordinates printed in the record, not landing points. For a failed or off-target landing, the marker is the intended site. A marker's colour and its words are the furthest step on the evidence ladder by any record there; How far has anyone got? explains them.
Decorative: The stars and Earth's surface. Earth's position, size and phase are computed; its clouds are not real.
Rendered with three.js 0.184.0 (MIT licence).